capxgain.com

Malpani Pipes IPO

The Malpani Pipes IPO will open for subscription on January 29, 2025, and close on January 31, 2025. The company plans to raise around ₹25.92 crores, with the issue consisting of a fresh issue of the same amount and an offer for sale of equity shares. The face value of each share is ₹10, and the price band for the IPO is set between ₹85 and ₹90 per share. The retail investors will have a 35% quota, while 50% is allocated for Qualified Institutional Buyers (QIBs) and 15% for High Net-Worth Individuals (HNIs). Based on its financial performance, Malpani Pipes has reported revenue of ₹141.16 crores in FY 2024, a significant rise from ₹82.57 crores in FY 2023. The company also posted a profit of ₹7.40 crores for FY 2024, up from ₹2.08 crores the previous year. Investors interested in the IPO can expect the stock to list on BSE on February 3, 2025, with allotments scheduled for February 5, 2025. Given the company’s growth in both revenue and profit, the IPO could be considered a promising option for long-term investment in the expanding plastic pipes industry.

Malpani Pipes IPO Details

Malpani Pipes IPO

More About Malpani Pipes IPO

Malpani Pipes and Fittings Limited appears to be a growing and innovative company in the piping industry. Since its establishment in 2017, it has rapidly gained recognition for offering a wide range of high-quality pipes, including HDPE Pipes, MDPE Pipes, Sprinkler Pipes, Drip Irrigation Pipes, PE Lateral Pipes, PE Sewerage Pipes, and PE Gas Pipes. These products cater to vital sectors such as agriculture, infrastructure, and telecom, where reliability and durability are essential.

The company’s vision to become a global leader while maintaining a focus on sustainability and innovation shows their commitment to long-term growth and environmental responsibility. Their substantial revenue of ₹141.11 Cr in FY 2024 reflects their strong market position and business expansion.

The emphasis on employees as the “most valuable things” for the business is noteworthy, as it highlights Malpani Pipes’ investment in human resources as a key driver of their success. By adhering to top industry standards, they ensure their products offer optimal efficiency and cost-effectiveness, which is crucial for maintaining competitiveness in a fast-paced market.

Overall, Malpani Pipes and Fittings Limited seems well-positioned for continued success with a strong focus on quality, employee development, and sustainability.

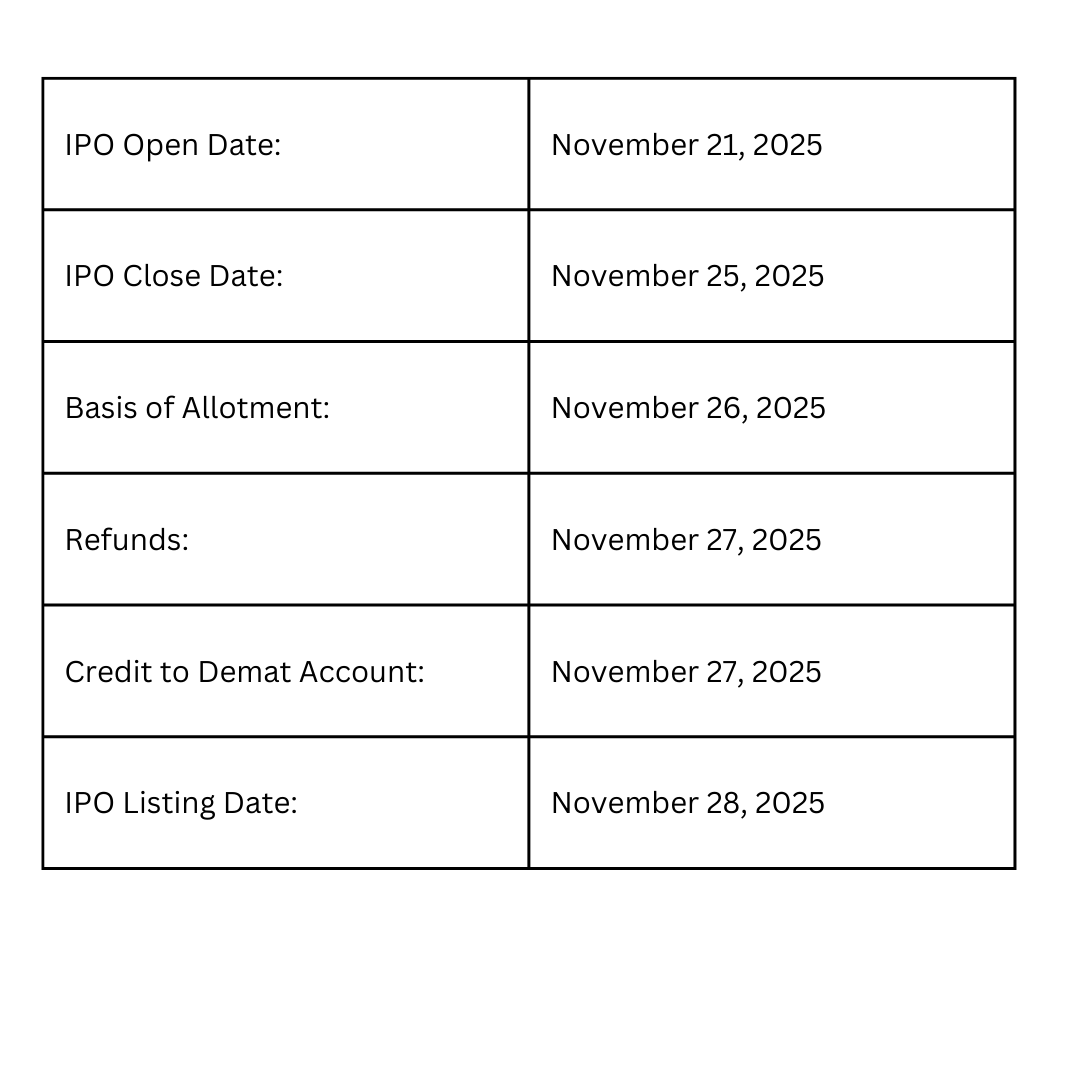
Malpani Pipes IPO Date

Malpani Pipes IPO

Malpani Pipes IPO Market Lot

Malpani Pipes IPO

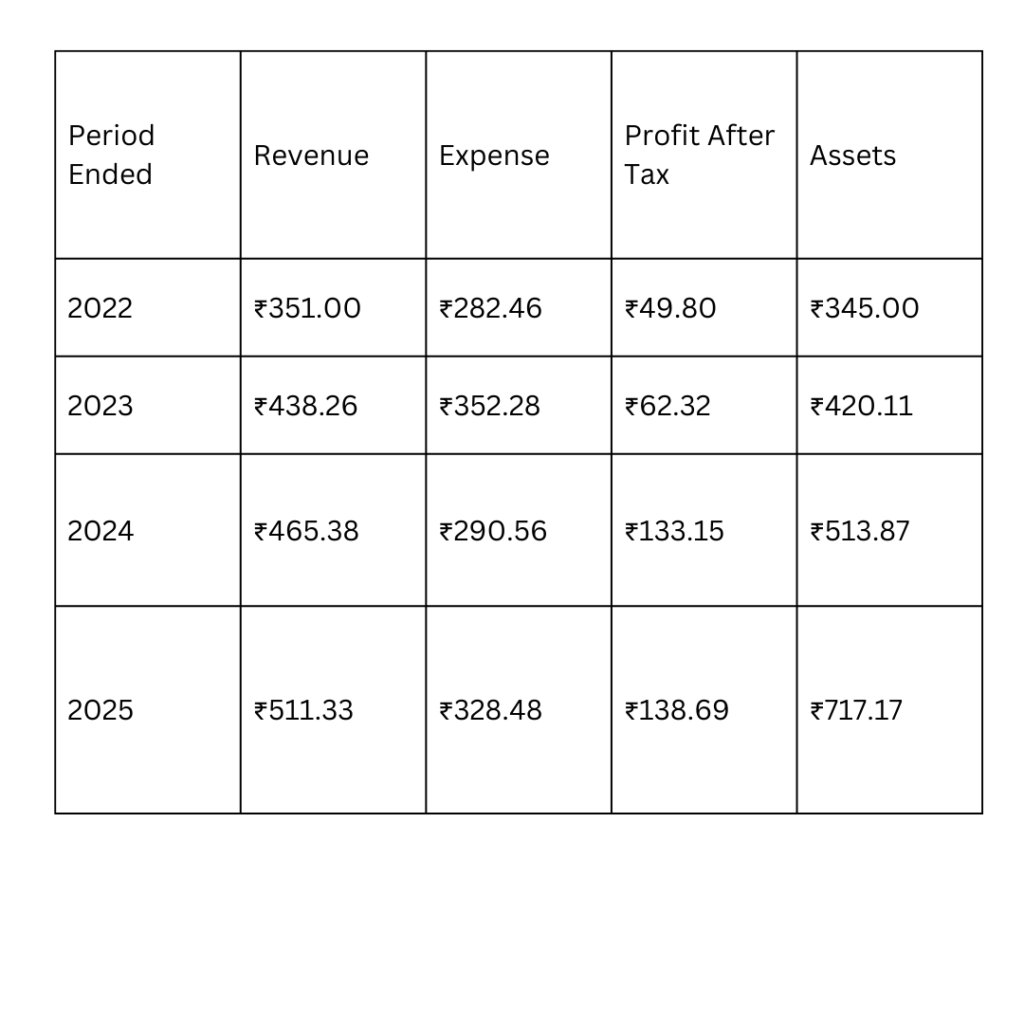
Malpani Pipes IPO Company All Financial Report

Amount ₹ in CroresMalpani Pipes IPO
Malpani Pipes IPO Company All Financial Analysis

  1. ROE (Return on Equity): 71.52%

    • Interpretation: This is a high return, indicating that the company is generating significant profit relative to its equity. A ROE above 20-25% is generally considered strong, so 71.52% is exceptional, suggesting efficient management and a high return on shareholders’ investments.
  2. ROCE (Return on Capital Employed): 21.74%

    • Interpretation: This is also a solid metric, showing the company’s ability to generate returns from its capital. A ROCE above 15% is considered good, so 21.74% indicates effective use of both equity and debt capital.
  3. EBITDA Margin: 9.41%

    • Interpretation: EBITDA margin measures operating profitability as a percentage of total revenue. A 9.41% margin can be considered moderate to good, depending on the industry, showing the company’s ability to generate profit from core operations before accounting for interest, taxes, depreciation, and amortization.
  4. PAT Margin (Profit After Tax): 5.25%

    • Interpretation: The PAT margin is relatively low compared to the EBITDA margin, meaning that while the company is profitable at the operating level, it may be facing higher taxes, interest expenses, or other factors that eat into its net profit.
  5. Debt to Equity Ratio: 2.04

    • Interpretation: This is a high ratio, suggesting the company has more debt than equity. A ratio above 1 is considered high and could indicate financial risk, particularly if the company struggles with interest payments or faces downturns. However, depending on the industry, high debt can be a common feature for capital-intensive businesses.
  6. Earnings Per Share (EPS): ₹37.17 (Basic)

    • Interpretation: EPS represents the portion of a company’s profit allocated to each outstanding share of common stock. A basic EPS of ₹37.17 indicates solid profitability on a per-share basis. This is generally a good sign for investors, assuming the market price reflects the earnings potential.
  7. Price/Earnings (P/E) Ratio: N/A

    • Interpretation: The absence of a P/E ratio could suggest that the company is either not profitable or it does not have enough data for a meaningful P/E calculation. Alternatively, it could also mean the company is in a transition phase or investing heavily in growth, which would make earnings volatile.
  8. Return on Net Worth (RoNW): 50.07%

    • Interpretation: This is a strong return, indicating that the company is generating excellent profits relative to its net worth (equity). A RoNW above 15-20% is typically seen as very good, so 50.07% indicates an efficient and profitable business model.
  9. Net Asset Value (NAV): ₹60.80

    • Interpretation: NAV refers to the total value of a company’s assets minus its liabilities, often used in valuing companies or investment funds. The NAV of ₹60.80 reflects the book value per share, but its relevance depends on the current market price and investor sentiment.

Summary:

  • The company shows exceptional profitability, especially in terms of ROE and RoNW, suggesting efficient management and high returns for shareholders.
  • EBITDA and PAT margins show profitability at different levels, but the PAT margin could be improved.
  • The high debt-to-equity ratio may pose financial risk, but it’s not unusual in some industries.
  • The absence of a P/E ratio suggests either low or volatile earnings.
  • EPS indicates a strong performance per share.