Stallion India IPO
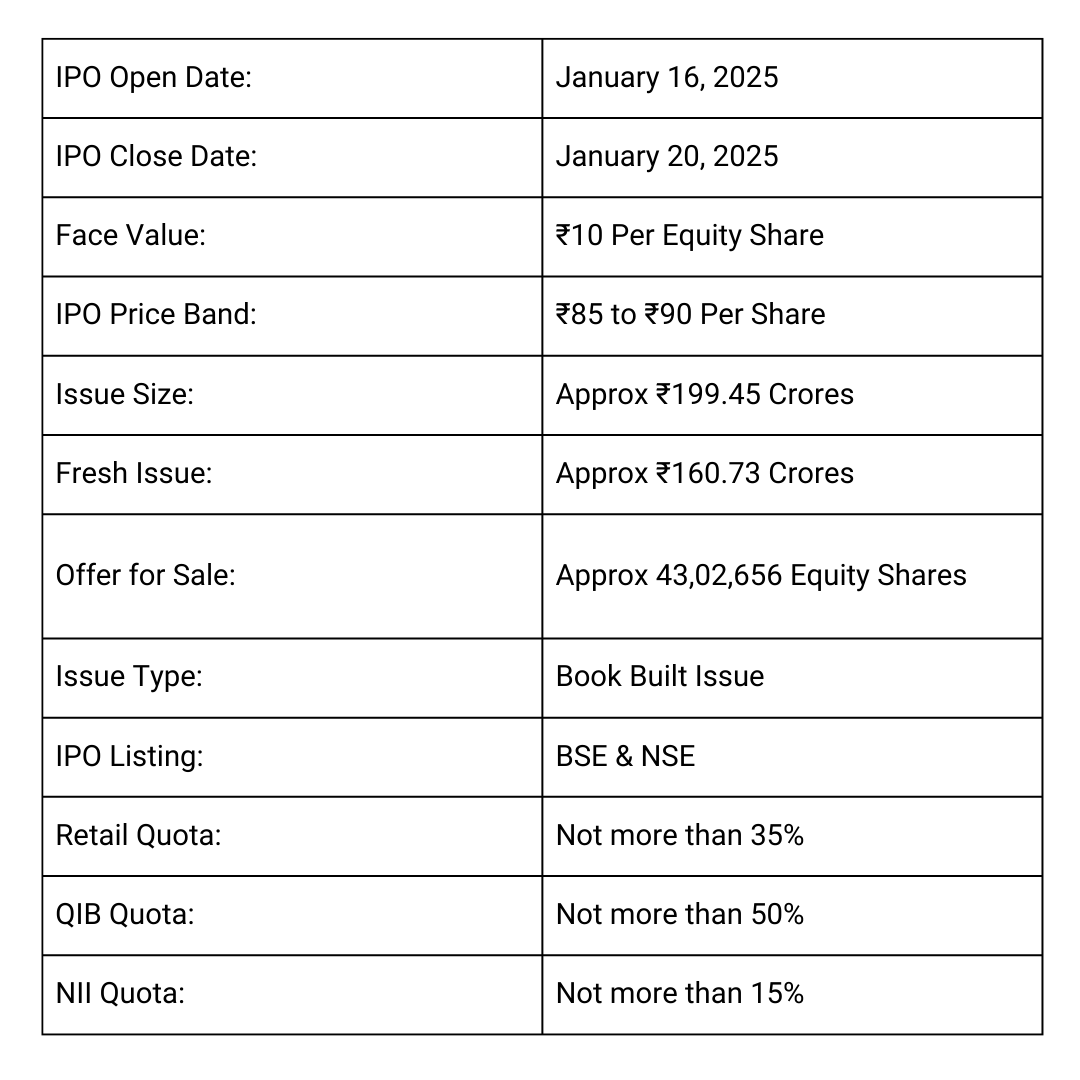
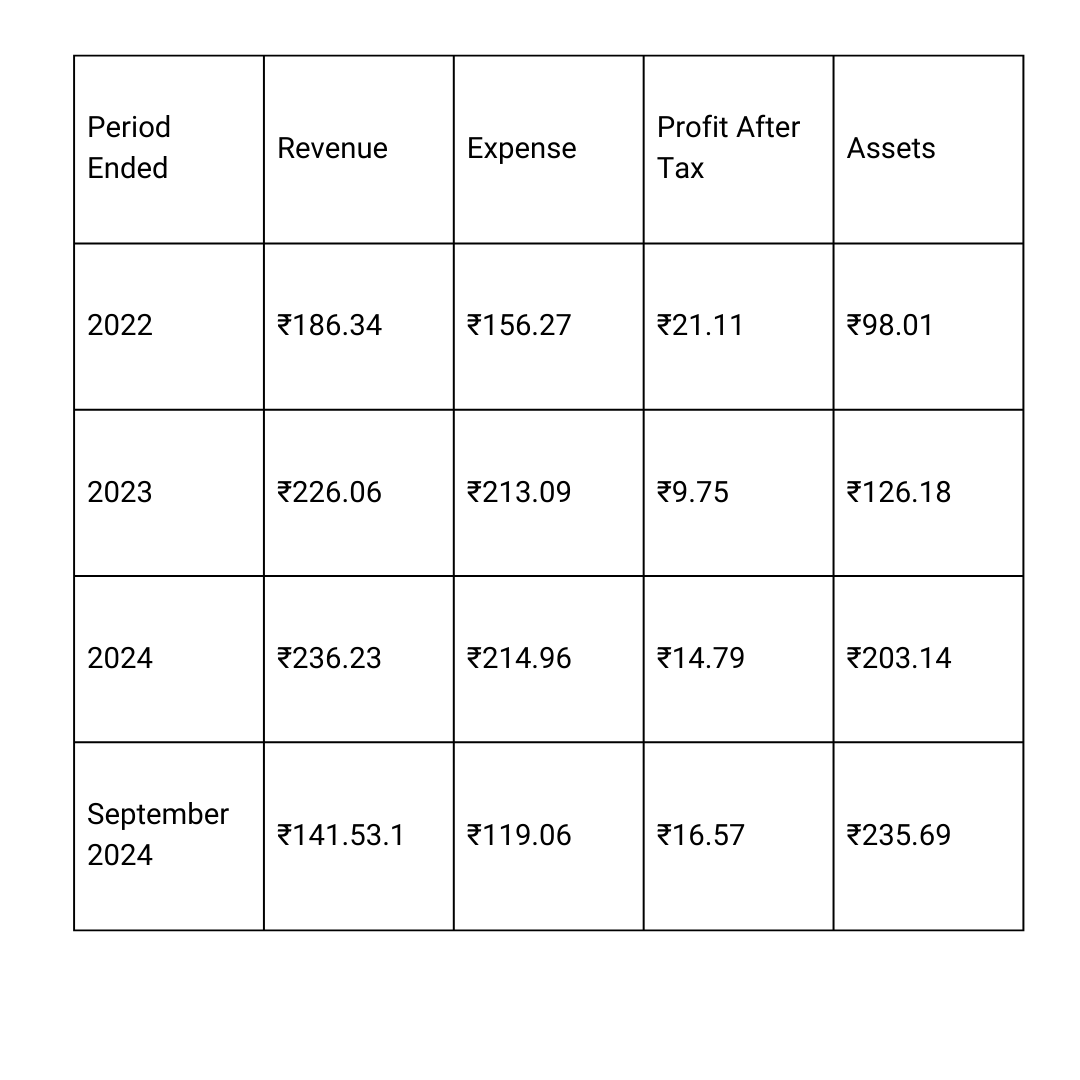
The Stallion India IPO will open on January 16, 2025, and close on January 20, 2025. This is a Book Built Issue aiming to raise ₹199.45 crores, comprising a fresh issue of ₹160.73 crores and an offer for sale of up to 43,02,656 equity shares with a face value of ₹10 each. The price band for the IPO is set at ₹85 to ₹90 per share, with a retail investor quota of 35%, QIB at 50%, and HNI at 15%. The IPO is scheduled to list on the BSE and NSE on January 23, 2025, with allotment finalized on January 21, 2025. Financially, the company reported revenue of ₹236.23 crores in 2024, up from ₹226.06 crores in 2023, and profits of ₹14.79 crores in 2024 compared to ₹9.75 crores in 2023, reflecting consistent growth. With proceeds allocated for expansion and operational strengthening, the IPO is considered a promising long-term investment opportunity.
Stallion India IPO Date, Review, Price, Allotment Details

More About Stallion India IPO
Founded in 2002, Stallion India Fluorochemicals Limited is a rapidly growing company specializing in the supply and production of refrigerants and a wide variety of gases. With nearly two decades of expertise in debulking, bottling, and distributing fluorochemicals, the company has established itself as a significant player in the industry.
Stallion India is also renowned for developing custom gas formulations by combining two or more gases to create innovative products. The company’s portfolio primarily includes two main types of gases: HFC (hydrofluorocarbon) and HFO (hydrofluoroolefin), which serve a broad spectrum of industries.
Plant Locations
Stallion India operates four state-of-the-art facilities located in:
- Khalapur, Raigad (Maharashtra)
- Ghiloth, Alwar (Rajasthan)
- Manesar, Gurugram (Haryana)
- Panvel, Raigad (Maharashtra)
Industries Served
Their gases find applications in diverse sectors, including:
- Semiconductor manufacturing
- Automotive industry
- Electronics
- Pharmaceuticals and medical fields
- Fire extinguishment systems
- Spray foam production
- Glass bottle manufacturing
- Aerosol production
Vision and Growth
Stallion India aims to expand its offerings across a broader range of gases and solidify its position as a trusted leader in the industry.
Financial Performance
In the first half of FY 2023 (April to September), the company achieved operational revenue of ₹9,274.39 crores.
Stallion India IPO Dates

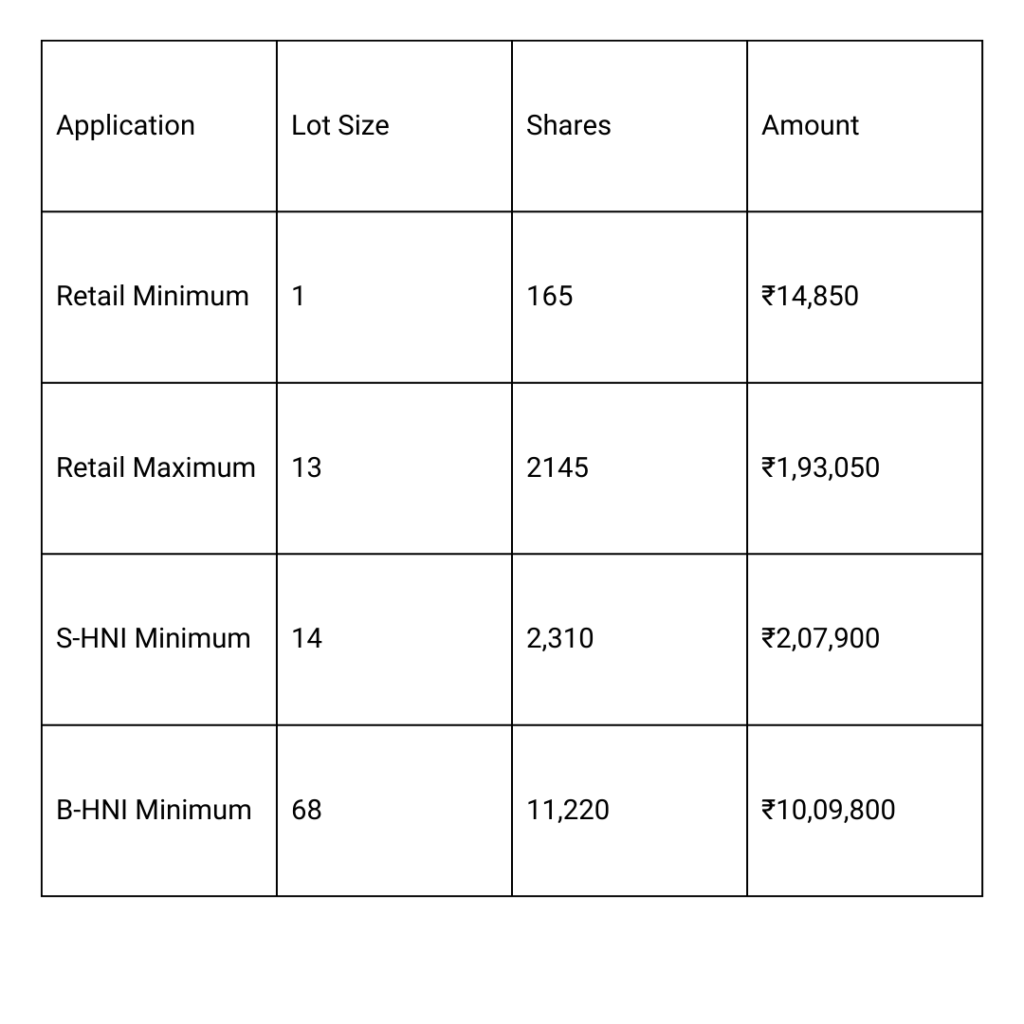
Stallion India IPO Market Lot

Stallion India IPO Company All Financial Report

Stallion India IPO Company All Financial Analysis
1. ROE (Return on Equity): 12.54%
- This shows the profitability of the company relative to shareholders’ equity. A ROE of 12.54% indicates the company generates ₹12.54 in profit for every ₹100 of equity invested.
2. ROCE (Return on Capital Employed): 13.96%
- ROCE measures the efficiency with which the company uses its capital to generate returns. A value of 13.96% suggests that the company is efficiently utilizing its overall capital.
3. EBITDA Margin: 11.30%
- This metric shows the operating profitability as a percentage of revenue. An EBITDA margin of 11.30% means ₹11.30 of EBITDA is earned for every ₹100 of revenue.
4. PAT Margin (Profit After Tax Margin): 6.26%
- Indicates the net profit generated as a percentage of revenue. A PAT margin of 6.26% reflects the company’s ability to convert revenue into net profit effectively.
5. Debt-to-Equity Ratio: 0.55
- This measures financial leverage. A ratio of 0.55 implies that for every ₹1 of equity, the company has ₹0.55 in debt, which is generally considered a moderate level.
6. Earnings Per Share (EPS): ₹2.54 (Basic)
- EPS represents the portion of a company’s profit allocated to each outstanding share of stock. A basic EPS of ₹2.54 indicates the earnings per share for the reporting period.
7. Price/Earnings (P/E) Ratio: N/A
- The P/E ratio is not available, possibly because the stock price data or earnings is missing, or it could be due to negative earnings in the prior periods.
8. Return on Net Worth (RoNW): 12.54%
- Similar to ROE, this metric indicates the return generated on shareholders’ equity. A 12.54% RoNW aligns with the ROE value provided.
9. Net Asset Value (NAV): ₹19.19
- NAV represents the per-share value of the company’s net assets. ₹19.19 per share suggests the company’s net worth per share based on its assets and liabilities.
